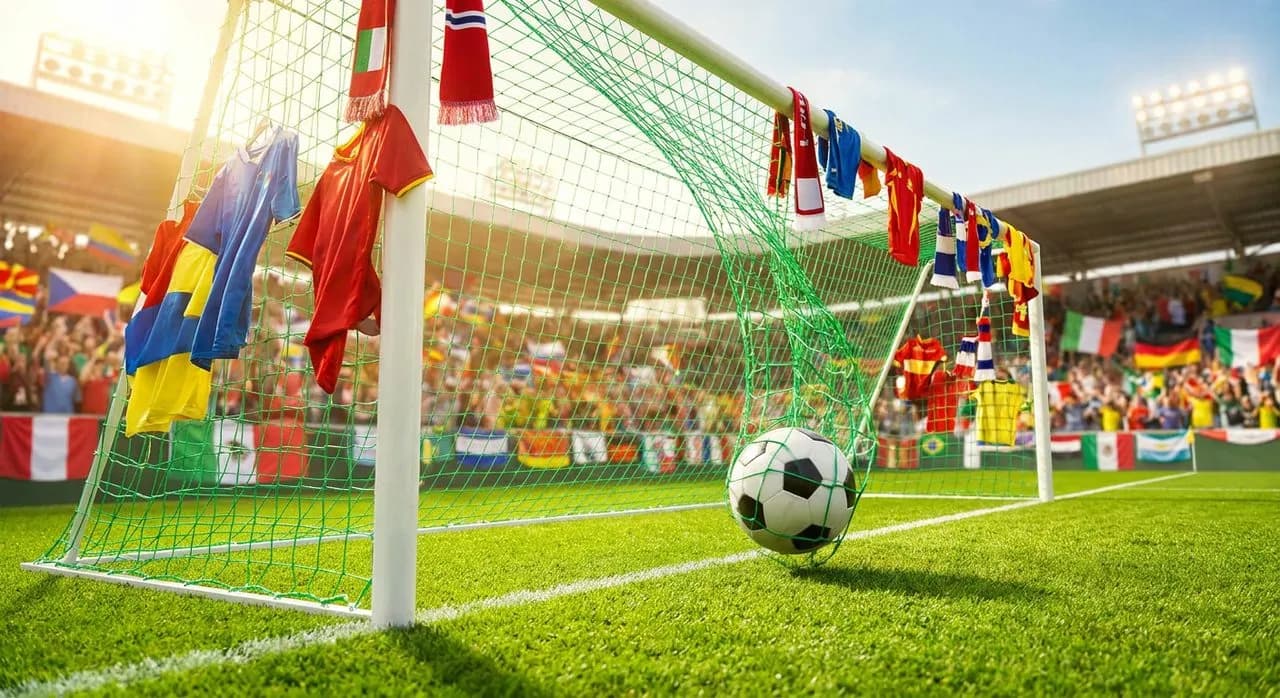
The Expanded Format Changes Everything
The jump to 48 teams has fundamentally altered the Golden Boot equation. More matches mean more opportunities, but they also mean deeper squads, rotation strategies, and the physical toll of a longer tournament. The group stage alone now features 104 matches across sixteen groups, and top teams can play up to eight games if they reach the final on July 19 at MetLife Stadium in East Rutherford. That's a marathon, not a sprint, and the numbers reflect it.
Text Karpo Now: Get real-time Golden Boot updates, match-day alerts, and the inside track on scoring records as the tournament unfolds.
Historically, Golden Boot winners averaged between six and eight goals across a traditional 32-team tournament. This year, the threshold could climb higher simply because there are more minutes on the pitch. But volume alone doesn't tell the story. The most efficient strikers—those converting chances at the highest rate—are the ones who tend to pull ahead when the knockout rounds tighten and defenses become more disciplined.
What matters now is not just how many goals a player scores, but when and how. A hat-trick in the group stage carries the same tally as three goals spread across three knockout matches, but the latter often signals a player who can deliver under the highest pressure. The math is simple, but the context is everything.
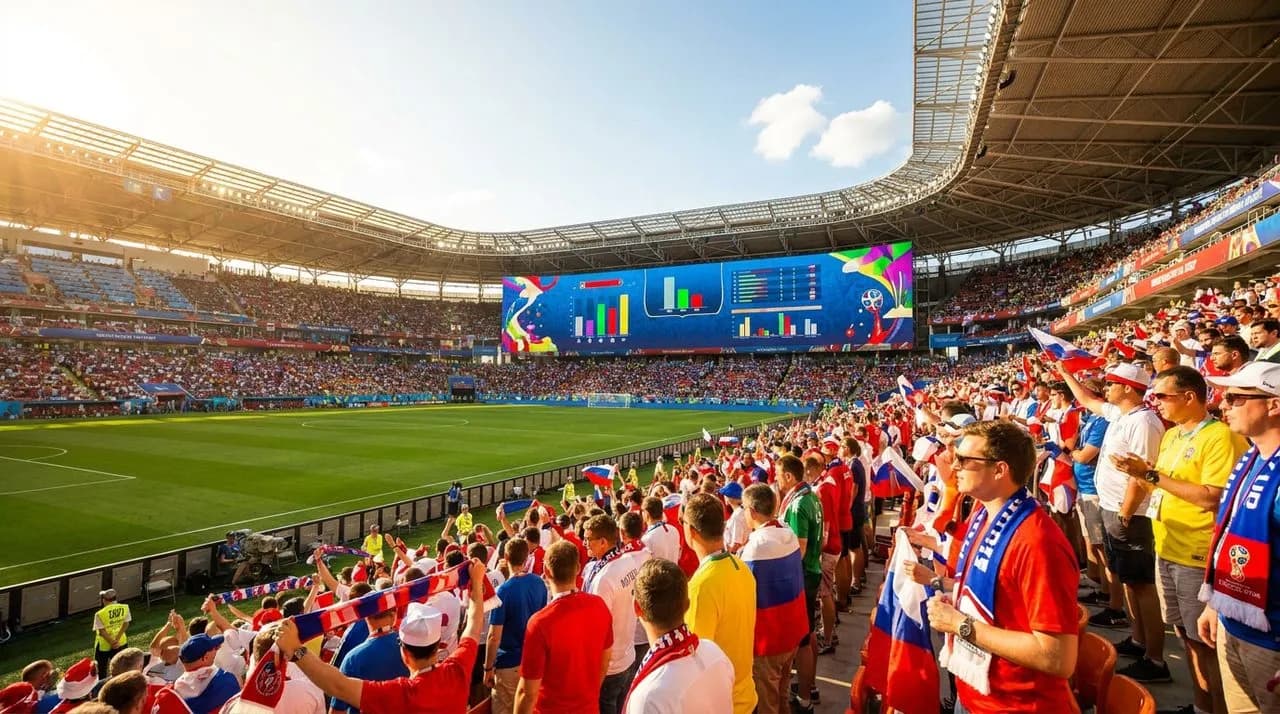
Goals Per Minute: The Efficiency Metric That Matters
Raw goal totals dominate headlines, but goals per minute played is the metric that separates clinical finishers from volume scorers. A striker who plays every minute of eight matches logs 720 minutes. If they score eight goals, that's one every 90 minutes—a full match. But a player who scores six goals in 400 minutes, coming off the bench or being subbed early, is converting at a far higher rate. That efficiency often signals a player in peak form, one who doesn't need endless touches to find the net.
This ratio becomes especially revealing in the knockout stages, where coaches manage minutes carefully and rotate to preserve energy. A forward who can change a match in a 20-minute cameo is worth their weight in gold, and the stats bear that out. The Golden Boot race often hinges on these marginal gains—one extra goal in limited time can swing the entire leaderboard. It's why analysts watch substitution patterns as closely as starting lineups.
Penalties: The Tiebreaker That Tilts the Scale
When two players finish level on goals, the first tiebreaker is assists, and the second is minutes played. But before it even gets there, penalties can be the difference. A player who steps up from the spot consistently—whether in open play or during a shootout that counts toward individual tallies—racks up goals that others don't. Penalty conversion rates matter, and so does who gets the nod when the referee points to the spot.
Not every penalty is created equal, either. A spot-kick in the group stage, when a team is already up by two, carries less weight than one in a quarterfinal when the match is tied. Yet both count the same in the Golden Boot tally. The psychological pressure of taking penalties in knockout rounds can also reveal who has the nerve to deliver when it counts. The numbers show that the most prolific scorers are often their team's designated penalty takers, and that responsibility can add two or three goals to their total by tournament's end.
It's a controversial edge, but it's part of the game. A striker who earns penalties through pace and positioning is doing their job, and converting them is a skill in itself. The stats don't lie: penalty goals are goals, and they often decide who lifts the Golden Boot when the final whistle blows on July 19.

The Contender Profile: What the Numbers Say
The leading scorers at this stage of the tournament share a few common traits. They're playing for teams that have advanced deep into the knockout rounds—often past the quarterfinals. They're getting consistent minutes, either as starters or high-impact substitutes. And they're clinical in front of goal, with conversion rates above 20 percent on their shots. That last figure is crucial: in a tournament where defenses are world-class, wasting chances is a luxury no one can afford.
Most contenders are also surrounded by creative midfielders who can deliver the ball into dangerous areas. A striker's goal tally is as much a reflection of their team's system as it is of individual brilliance. The numbers show that players in possession-heavy sides, or those who counter-attack with speed, tend to rack up more attempts on goal. It's a team sport, and the Golden Boot often goes to the player whose squad creates the most high-quality chances.
Geography plays a role, too. Teams playing more matches in climate-controlled venues like AT&T Stadium in Arlington—which hosts nine matches, the most of any venue—may have a slight endurance advantage over those playing in open-air stadiums in hotter climates. It's a marginal factor, but in a race this tight, every detail counts.
What It Takes to Win From Here
For a player to claim the Golden Boot now, they likely need to be part of a team that reaches at least the semifinals at AT&T Stadium or Mercedes-Benz Stadium in Atlanta. That's a minimum of seven matches, and realistically eight if they make the final. Scoring in every knockout round is nearly essential—one goal per match from the Round of 16 onward would add four to their tally, and that's often enough to separate the leader from the pack.
The math also favors players whose teams are still competing in multiple competitions or who have faced tougher defensive sides and still found the net. A goal against a defensive powerhouse in a quarterfinal—like the France versus Morocco match that took place in the Boston area, with France advancing—carries more weight in the narrative, even if the tally is the same. Voters and analysts remember context, and the Golden Boot often reflects not just quantity but the quality of opposition faced.
Tracking the Race in Real Time
The beauty of the Golden Boot chase is that it unfolds live, match by match, across cities from coast to coast. Whether you're watching from a packed fan zone, a neighborhood sports bar, or your living room, the leaderboard shifts with every goal. The expanded format means more drama, more late-game heroics, and more chances for a dark horse to surge ahead in the final week.
Fans in host cities are living this race in real time, and the energy is electric. From the group stages to the final whistle at MetLife Stadium on July 19, every goal matters. The numbers are the story, but the moments—the celebrations, the roars, the disbelief—are what make the Golden Boot chase unforgettable. It's not just about who scores the most; it's about who delivers when the world is watching.
As the tournament enters its final stretch, the stats will crystallize into a clear picture. But until then, every match is a chance for someone to rewrite the leaderboard. That's the magic of the numbers: they're always in motion, always one strike away from a new chapter.
Practical notes
- Golden Boot tiebreakers: goals, then assists, then fewest minutes played—penalties from open play count, shootout goals do not affect the tally.
- Most contenders play for teams reaching at least the semifinals, logging seven or eight matches and 600-plus minutes by tournament's end.
- Efficiency matters: top scorers often convert 20 percent or more of their shots, with goals-per-90-minutes ratios above one in peak form.
- Penalty takers have a statistical edge, often adding two to three goals from the spot across a deep tournament run.
- Follow live stats and leaderboards via official tournament apps and broadcaster feeds for real-time updates as matches unfold across all host cities.
The Golden Boot is more than a trophy; it's a testament to consistency, nerve, and the ability to deliver when the stakes are highest. As the tournament races toward its conclusion, the numbers will tell us who stood tallest, but the memories—the goals that mattered, the moments that shifted momentum—will linger long after the final tally is set. This is the race within the race, and it's unfolding right now across North America.
Tags: #GoldenBoot #WorldCup2026 #SoccerStats #StrikerWatch #TournamentScorers #GoalsPerMinute #KnockoutStage #FootballAnalytics #MetLifeStadium #ATTStadium #WorldCupFinal #ScoringLeaders #PenaltyConversion #MatchDayStats #LiveFootball
All trademarks are the property of their respective owners.
Ask Karpo first
The numbers are live, the race is tight, and every goal could rewrite the leaderboard. Whether you're tracking stats, planning your match-day route, or just want to know which striker is peaking at the right time, Ask Karpo first. We'll keep you ahead of the curve with real-time insights, neighborhood watch spots, and the context behind every goal that matters. Text us, and let's follow this race together.